
What is New Relic?
New Relic is an observability platform founded in 2008 that enables real-time monitoring of web application performance, infrastructure, and browsers from a single interface. According to its official documentation, more than 16,000 organizations use New Relic to detect and resolve performance issues before they impact end users — including ecommerce teams that need full visibility into every HTTP transaction, database call, and external service.
This tool tracks and provides real-time performance details for your web application. Development teams can analyze the data to understand what causes performance issues and act on them immediately.
New Relic Infrastructure provides dynamic and flexible server monitoring. It enables operations teams to make decisions about complex systems — from a physical data center to thousands of Amazon EC2 or Microsoft Azure instances. For more detail, see the official New Relic Infrastructure documentation.
Among its many services, New Relic is best known for its Application Performance Monitoring (APM). Since it operates as software as a service (SaaS), you can use it from any web browser without any additional installation. New Relic supports native agents for PHP, Java, Python, Ruby, Node.js, .NET, Go, and more. See the full list and supported versions at docs.newrelic.com/docs/agents.
This article was first published on January 25, 2024, and updated in May 2026.
How does New Relic work?
New Relic structures all of its observability around four data types known as MELT — a model adopted from OpenTelemetry that New Relic natively integrated starting in 2021 (source: docs.newrelic.com/docs/data-apis):
- Metrics: aggregated numerical measurements — load time, CPU usage, memory consumption — reported as time series.
- Events: discrete records of activities with key-value attributes; they form the foundation of queries in NRQL (New Relic Query Language).
- Logs: timestamped text records that are automatically correlated with traces to facilitate diagnosis.
- Traces: a chain of spans representing the complete journey of a request across services, showing the chronological sequence of each step.
New Relic uses an agenta lightweight module installed within your web application or server that instruments code at the method level to collect these four data streams and send them to the platform. According to benchmarks published by New Relic in 2023, the typical CPU overhead of the agent is less than 3%, making it suitable for production environments with no perceptible impact on the end user.
Each monitoring environment requires a dedicated agent. Separate agents exist for applications, infrastructure, and web browsers. New Relic retrieves data from the agent and displays it on the dashboard, where teams can identify the root cause of each issue and resolve it immediately.
What can New Relic APM be used for?
APM (Application Performance Monitoring) is the core of New Relic. Below we explain how to use its main features to improve the performance of your ecommerce site.
Monitoring
New Relic APM offers unified monitoring functionality that tracks your website and its microservices, with code-level analysis for precise troubleshooting.
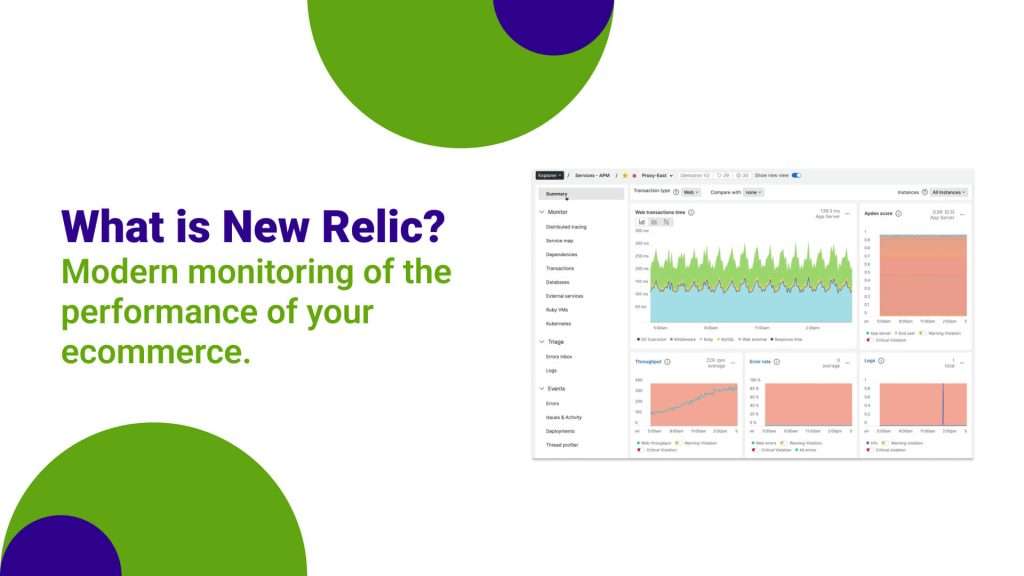
On the APM Summary page you can view the most important performance metrics:
- Transaction response time: the duration of a transaction from the requester's perspective. It does not reflect the total time spent on a complete transaction.
- Apdex score: a standard user satisfaction metric calculated using the formula
Apdex = (Satisfied + Tolerating × 0,5) / Total requests. In New Relic, the default T threshold is 0.5 seconds: a transaction that responds in ≤ T is considered satisfactory, between T and 4T (2s) tolerable, and above 4T frustrating. An Apdex of 1.0 is perfect; values below 0.7 are classified as critical and trigger automatic alerts. The threshold is configurable per application under Settings > Application. - Throughput: user activity measured in requests per minute (RPM).
- Error rate: the percentage of transactions that return errors relative to the total during a given time interval. Unhandled exceptions typically trigger this type of error in New Relic.
- Host resources used: CPU and memory consumption on the host server.
Note: in New Relic APM, transactions refer to activities that begin when the application receives HTTP requests and end when it sends responses.
In addition to the APM Summary, there are specialized pages for each area:
- Distributed tracing: records duration, errors, paths, and span counts for traces across services.
- Transactions: lists requests, top transactions by time percentage, throughput, and server resource usage.
- Kubernetes: displays deployment age, available pods, pod logs, and real-time metric comparisons.
- Databases: shows transactions, operations, throughput, and database response times.
- External services: details throughput, response time, and error rate for upstream and downstream entities.
New Relic APM can also collect metrics from external environments, including cloud resources and network traffic, through its external services metrics.
Subscribe to our newsletter.
Get the latest insights on digital solutions, industry trends, expert articles, and upcoming events.
Reporting and Alerts
New Relic APM includes service level agreement (SLA) reports that track your site's uptime, downtime, and trends over time. The SLA report is available in daily, weekly, or monthly format and can be downloaded as a CSV file directly from APM.
The alerting feature automatically notifies you of performance anomalies when specific metrics exceed custom thresholds. A typical ecommerce configuration example: alert when the error rate exceeds 1% over a 5-minute window, or when average response time exceeds 2 seconds.
Dashboard Creation
The New Relic dashboard collects and displays site performance information on a single screen. You can customize the layout, resize charts, and filter the information displayed to suit your needs, using NRQL (New Relic Query Language) to build custom queries.
New Relic makes it easy to create multiple dashboards for different purposes — for example, one to monitor ecommerce performance across two different geographic markets. Dashboards can also be shared with other teams to improve collaboration.
Reviewing Traces and Logs
New Relic APM records all transactions and database calls in detail. You can drill down into these transaction traces to determine which services are slowing down the application the most. The standard plan retains trace data for 8 days.
The platform lets you view the log messages associated with each transaction trace by searching for keywords in the Logs interface. Combining traces and logs enables precise error diagnosis and significantly reduces resolution time.
New Relic integrations with AWS
New Relic's Amazon integrations allow you to monitor AWS data across multiple platform products. Available integrations include AWS API Gateway, AWS DynamoDB, AWS VPC, and AWS EC2, among others. For the full list, visit docs.newrelic.com/docs/infrastructure/amazon-integrations.
Any user can view and inspect AWS data reports in their New Relic Infrastructure account. Only owners, admins, or infrastructure add-on managers can add or modify AWS integrations.
The benefits of New Relic
New Relic stands out from other observability tools for the following reasons, backed by reviews on G2 and Gartner Peer Insights (2023–2024 data):
- Simple setup. Its guided installation automatically detects the environment and configures the agent accordingly, with no additional manual configuration needed in most cases.
- Unified platform. Unlike solutions such as Datadog, whose pricing scales linearly with the number of hosts, New Relic One bills primarily by ingested data volume (GB/month), which is more predictable for mid-size teams.
- Instrumentation depth. New Relic instruments at the method level — not just the endpoint level — making it possible to identify the specific line of code causing latency, without having to manually reproduce the error.
- Transaction throughput. You can see which components of your application take the longest to load and prioritize optimizations using real production data.
- Adaptable interface. New Relic's UI allows you to customize the dashboard for different user profiles, from backend engineers to business teams who only need to see availability and Apdex metrics.
Conclusion
New Relic is a real-time observability platform that, since its founding in 2008, has evolved toward a unified model based on OpenTelemetry's MELT standard. Its APM enables monitoring from the infrastructure level down to the line of code, with actionable metrics such as Apdex, distributed traces, and automatic log correlation.
For ecommerce teams that need to detect and resolve performance issues before they affect conversion, New Relic offers a combination of technical depth, ease of installation, and customizable dashboards that is hard to match at its price point.
Do you need to develop a digital solution for your business?
Contact us today here to start an incredible project together.

Digital Marketing Manager at Orienteed.
I lead the planning and execution of Orienteed's digital marketing strategy with a fantastic team, making sure it aligns with our strategic goals and drives business growth. I'm really into inbound marketing, web design, and creating content that matters.
I wrote the book: "How to Create a Profitable Blog Today."
"Marketing is about values. It’s a complicated and noisy world, and we’re not going to get a chance to get people to remember much about us. No company is. So we have to be really clear about what we want them to know about us."
—Steve Jobs